Loop 1 & ETL
ETL Overview
![]() Code ↗ |
Code ↗ |
![]() dbt Docs ↗ |
dbt Docs ↗ |
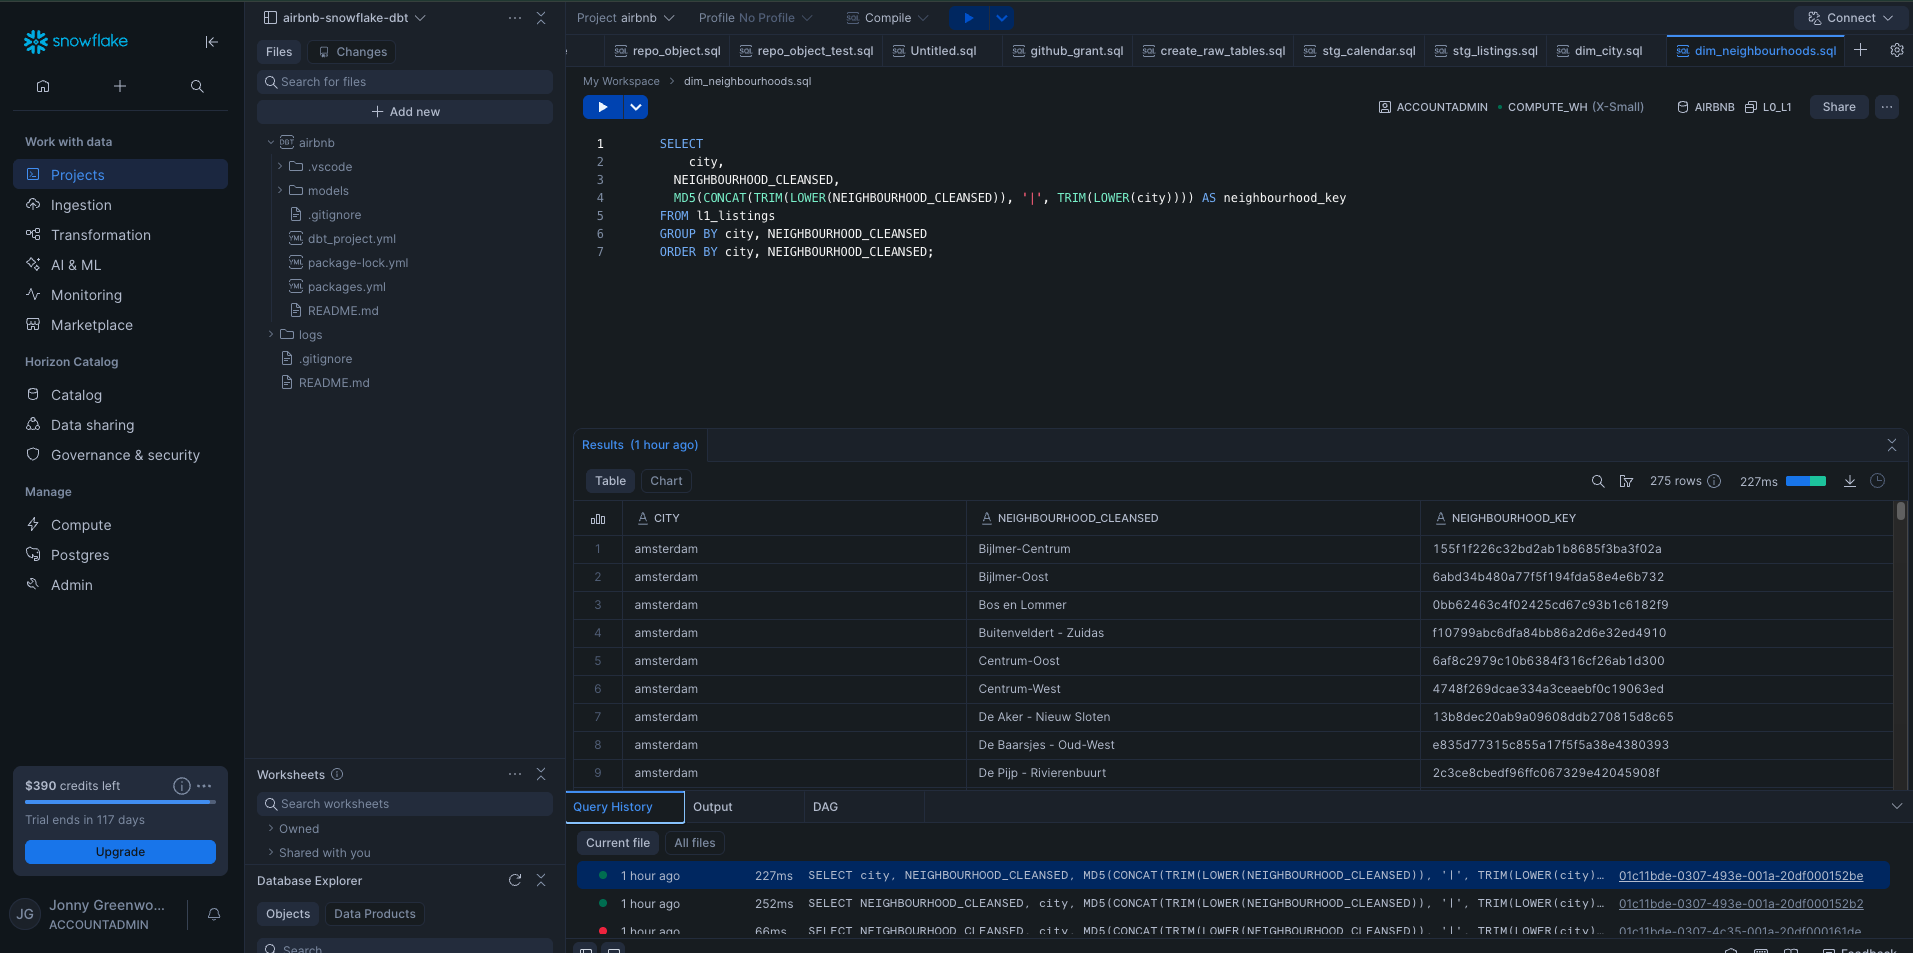
![]() Snowflake ↗ |
Snowflake ↗ |
![]() Project Management ↗
Project Management ↗
This project ingests Airbnb data from multiple online sources, each differing in structure, format, and data quality, and updated on an ongoing basis. This variability introduces complexity that requires a structured, auditable ETL approach rather than ad-hoc transformation. To manage this, I built a cloud-based ETL pipeline using Snowflake and dbt, organised into three layers:
- L0 [Bronze] – Ingest high-volume source files to preserve data fidelity and enable auditing.
- L1 [Silver] – Clean, reshape, and unify data for relational consistency.
- L2 [Gold] – Aggregate and prepare data for analysis, modelling, and reporting.
The diagram below illustrates how data flows through these layers into analytics-ready outputs.
---
config:
  layout: dagre
---
flowchart TB
 subgraph L0["L0 — Raw Layer"]
        A1["Raw Source Files
Eg CSV/Parquet"]
  end
subgraph L4["Data Profiling"]
        B1["Profile Data"]
  end
 subgraph L1["L1 - Cleansed Layer"]
        B2["Standardise Data"]
        B3["Cleanse Data"]
  end
 subgraph L2["L2 — Curated Layer"]
        C1["Aggregate Data"]
        C2["Apply Business Logic"]
        C3["Analytics / Reporting / Modelling"]
  end
 subgraph ETL["ETL Pipeline"]
    direction TB
        L0
        L4
        L1
        L2
  end
    A1 --> B1
    B1 --> B2
    B2 --> B3
    B3 --> C1
    C1 --> C2
    C2 --> C3
    A1 -.-> DB[("Snowflake
Warehouse + dbt")]
    B3 -.-> DB
    C3 -.-> DB
    DB <-.-> LR[["Local Git Repo"]]
    DB <-.-> KN[["External Tools"]]
This ETL setup is a critical component of Framework Loop 1, establishing the foundation required to answer early-stage business questions. Subsequent loops may ingest additional data sources and repeat parts of this process as analytical needs evolve.
File Storage
Before transformation begins, data storage and project structure are defined to ensure traceability and reproducibility.
A Snowflake database is created, and dbt sources, models, and folder conventions are used to explicitly define schemas and data lineage. This ensures every table can be traced back to its originating file and transformation logic.
Example schema structure:
airbnb.l0.example_data,
l2.fact_reviews.
Centralising storage in Snowflake simplifies downstream access while maintaining clear separation between raw, cleansed, and curated data.
L0 [Bronze]
L0 captures data exactly as received, without modification.
Data Acquisition
Python is used to scrape csv.gz files directly from the Inside
Airbnb open-data portal. Files are downloaded programmatically across multiple regions and placed into a
data/raw_data directory.
Python is then used to convert the csv.gz files to .parquet before being uploaded to Snowflake.
Python was chosen for this step because:
- Error handling and logging are more explicit than Snowflake CSV ingestion
- Schema inspection is easier prior to load
- The process is repeatable as new source files are added
L0 Load
Each file is loaded into Snowflake as a separate raw table, preserving original schemas and values. No cleaning or transformation occurs at this stage.
This layer exists purely to support auditing, replayability, and data confidence.
L1 [Silver]
The Silver layer focuses on cleaning, standardising, and validating the raw data. It’s where inconsistencies are corrected, schemas are aligned, and initial business rules are applied to make the data structurally consistent across sources.
Data Profiling
Before transformation, source-level sampling was performed to understand:
- Which columns exist and how they differ by source
- Column meaning and data types
- Common quality issues to address proactively
L1 Load
During the transition from L0 → L1:
- Field names are standardised
- Data types are explicitly cast
- Schemas are aligned across regions
- Records are grouped into consistent fact-style tables
- At this point, the data becomes relationally usable, but still avoids aggregation or opinionated business logic.
L2 [Gold]
The Gold layer contains data in its final, analytics-ready form.
For Framework Loop 1, this layer focuses on producing descriptive, decision-support tables rather than predictive models.
Example outputs:
l2.NEIGHBOURHOOD_PROPERTIESl2.NEIGHBOURHOOD_MARKET_SNAPSHOT
Analytics / Reporting / Modelling
Excel Model
The Excel model was built to support rapid feasibility analysis, allowing users to explore occupancy, rates, and listing density by city and neighbourhood.
Snowflake Examples
Example Snowflake dimension table: