
Skills
Please view my LinkedIn page for a list of my up-to-date qualifications.
Please note this page is regulary updated.
Languages
SQL
| Concept | Description | Examples from my Portfolio |
|---|---|---|
| Filtering and conditions | WHERE, IN, BETWEEN, LIKE — selecting relevant data cleanly |
02_L1/helper_L1_sales_columns.sql |
| Joins | Inner, left, right, and self joins for combining multiple tables | 05_Enrichment/l2_macros.sql |
| Aggregations | GROUP BY, SUM, AVG, COUNT, and conditional aggregation via CASE WHEN |
05_Enrichment/KPIs/kpi_month_var.sql |
| Subqueries and CTEs | Modular transformations and stepwise query logic | 05_Enrichment/KPIs/kpi_seasonality_strength.sql |
| Window functions | ROW_NUMBER(), LAG(), LEAD(), running totals, and partitioned averages |
02_L1/02_L1_keys.sql |
| Data reshaping | Pivoting, unpivoting, and flattening hierarchical data | 04_L2/02_create_L2_sales_long.sql |
| Data cleaning and validation | Handling nulls, deduplication, and constraint awareness (NOT NULL, UNIQUE) |
02_L1/01_L1_from_L0_ingest_std.sql |
| Schema literacy | Understanding fact/dimension models, keys, and relationships | 05_Enrichment/l2_macros.sql |
| Performance awareness | Knowing what indexes do, and writing efficient queries (avoiding cross joins, subquery loops) | 02_L1/02_L1_keys.sql |
| Transactions (light) | Basic BEGIN / COMMIT / ROLLBACK understanding for safe updates or staging |
|
| Analytical reporting | Building datasets for dashboards — KPIs, time comparisons, YoY, MAPE, bias | 05_Enrichment/KPIs/kpi_product_coeff.sql |
| Data warehousing concepts | OLAP vs OLTP awareness; star and snowflake schema fundamentals | |
| ETL logic in SQL | Using SQL to transform raw → standardized → analytical tables (L0–L2 pipeline pattern) | Process Overview |
Python
| Library / Concept | Description / Use Case | Examples from my Portfolio |
|---|---|---|
| pandas | Data manipulation and cleaning (eg filtering, joins, aggregations, reshaping) | sales_join.py |
| pyarrow | Efficient data interchange and Parquet file handling | 033_split_parquet.py |
| duckdb | SQL querying within Python; fast analytics on Parquet files | 01_create_L0_db.py |
| os / pathlib | File and folder management for automated ETL scripts | sales_join.py |
| Jupyter / VS Code notebooks | Interactive analysis, documentation, and rapid prototyping | schema_columns.ipynb |
| Data visualization | Quick checks using matplotlib / plotly |
|
| Basic Python syntax | Loops, conditionals, list comprehensions, functions | 034_profile_parquets.py |
| Environment setup | Using virtual environments, requirements.txt management | requirements.txt |
| Error handling & logging | Try/except, basic logging for pipeline reliability |
DAX
Examples taken from Business Insights Project
| Concept | Description | Examples from my Portfolio |
|---|---|---|
| Aggregation & Iterators | Using functions like SUM, AVERAGEX, and STDEVX.P to calculate totals, averages, and statistical metrics across dynamic contexts. |
AVERAGEX(ALL(dim_calendar[wm_yr_wk]), CALCULATE([Total Sales])) |
| Statistical Analysis | Implementing measures for Z-Score, Coefficient of Variation, and standard deviation to identify performance outliers and variability. | DIVIDE([Total Sales] - [Daily Sales Mean (AllSelected)], [Daily Sales StdDev (AllSelected)]) |
| Time Intelligence | Applying functions like CALCULATE, DATEADD, and ALLSELECTED to calculate YoY changes, rolling metrics, and trend comparisons. |
VAR PrevYear = CALCULATE([Total Sales], DATEADD('dim_calendar'[Date], -1, YEAR)) |
| Forecast Accuracy Metrics | Evaluating model performance using MAPE, Bias, and Bias % across multiple forecast models (Naïve, Drift, Rolling). | DIVIDE(ABS([Forecast Sales (SNaive)] - [Total Sales]), [Total Sales]) |
| Dynamic UX Measures | Creating contextual and narrative-style outputs with CONCATENATEX, IF, and FORMAT for clear, dynamic storytelling in dashboards. |
"Sales to Target: " & CONCATENATEX(VALUES('Calendar Periods'[Period]), 'Calendar Periods'[Period], ", ") |
| Context Management | Leveraging ALL, FILTER, and VAR to control filter context, compare subsets, and isolate time periods or product groups. |
CALCULATE([Total Sales], ALL(dim_product)) |
| Comparative & Ratio Analysis | Using DIVIDE and ALL to calculate contribution, growth, and ratio-based KPIs like Sales Share % or Sales vs Target. |
DIVIDE([Total Sales], CALCULATE([Total Sales], ALL(dim_product))) |
| Ranking & Highlights | Employing TOPN and RANKX to identify top-performing stores, products, or high-variability entities. |
TOPN(10, dim_store, [Sales CoV], DESC) |
| Helper & Validation Measures | Adding checks such as row counts, last data points, or selected-period summaries for QA and transparency. | CALCULATE(MAX(dim_calendar[Date]), FILTER(l2_sales_long_extended, l2_sales_long_extended[sales] > 0)) |
| Formatting & Readability | Applying conditional icons, numeric and text formatting (FORMAT, currency strings) for better interpretation and presentation. |
FORMAT([Total Sales], "$0.0,,,M") & IF([Sales $ YoY%] >= 0, " ▲", " ▼") |
Power Query M formula language
Custom M code tweaking when appropiate.
Software / Platforms
Use the links below to see examples of my work.
Power BI
Views based on the type of data and audience. See Live Demo for more detail.
Alteryx
Example coming soon: data cleansing, transformation, apps and macros.
Power Query
See Power Query M formula language
GitHub
All project code, documentation, and version history are hosted on GitHub.
Excel
Example of analytical modelling and structured price calculation in Excel. Information redacted - example of front end sheet for Sales Team. There were nine pages tailored to each lot, so a backend calculation page collated the infomation and calculations were done in one, more managable sheet.
Visual Studio Code
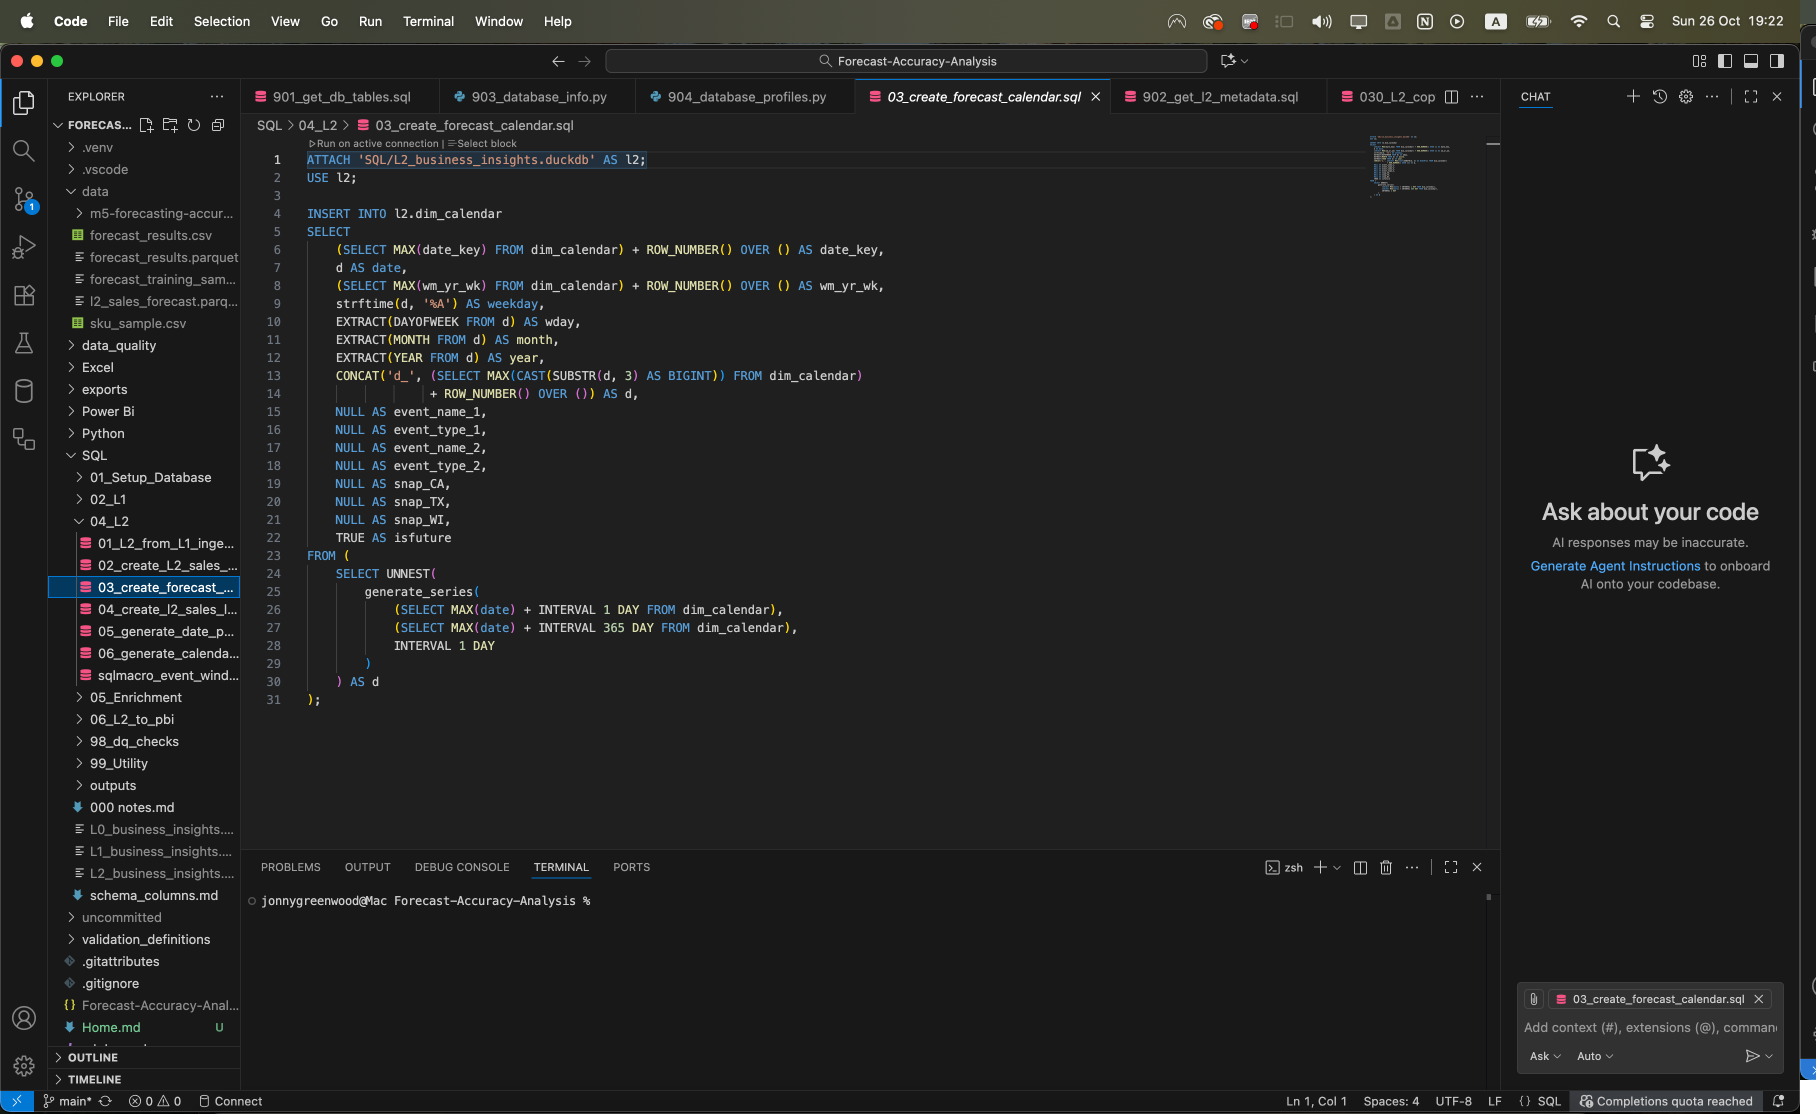
Shows how I manage workspaces, virtual environments, dependencies, and version control.