
Insights
Introduction
This page is the bridge between data and insights.
Exec Insights
The Executive View highlights key performance metrics and trends at a glance. Think, what's the story, what're the key takeaways. It's designed for stakeholders who need a high-level overview of sales, profitability, and product mix without navigating detailed reports.
From a first glance, we can identify our largest stores and top-performing categories across approximately 3,000 products. Total sales continue to grow year-on-year, although the rate of growth is slowing — suggesting market maturity or pricing stabilization.
A natural next question for leadership might be:
- Q: How much of our growth is driven by volume versus increases in average selling price (ASP)?
-
A: Overall, it shifts from volume to ASP growth, and we can see the YoY% growth differences in Product Sales Overview (bottom right). Note that it varies by year, and department.
Analyst Insights
The Analyst View focuses on identifying emerging patterns and exploring what’s driving performance changes in the data. It’s designed for stakeholders who want to dig one level deeper and translate findings into action.
From a first glance, we can see that Current Year CA_2 sales are 81% above
forecast. While
strong performance is positive,
it also increases the risk of supply not meeting demand. Selecting CA_2 in the top-center
visual reveals that
FOODS_2 has a target performance of 408%, though their
weighting also needs to be understood.
A natural next question for an analyst might be:
- Is this driven by increased sales, or poor forecast quality, or both? You can see for yourself by
filtering in the top right
(store_id="CA_2", dept_id="FOODS_2", year="2015, 2016, 2017") - Can the store provide more context — for example, a local market change?
- How should the forecast model be adjusted going forward?
Report Setup
Modelling
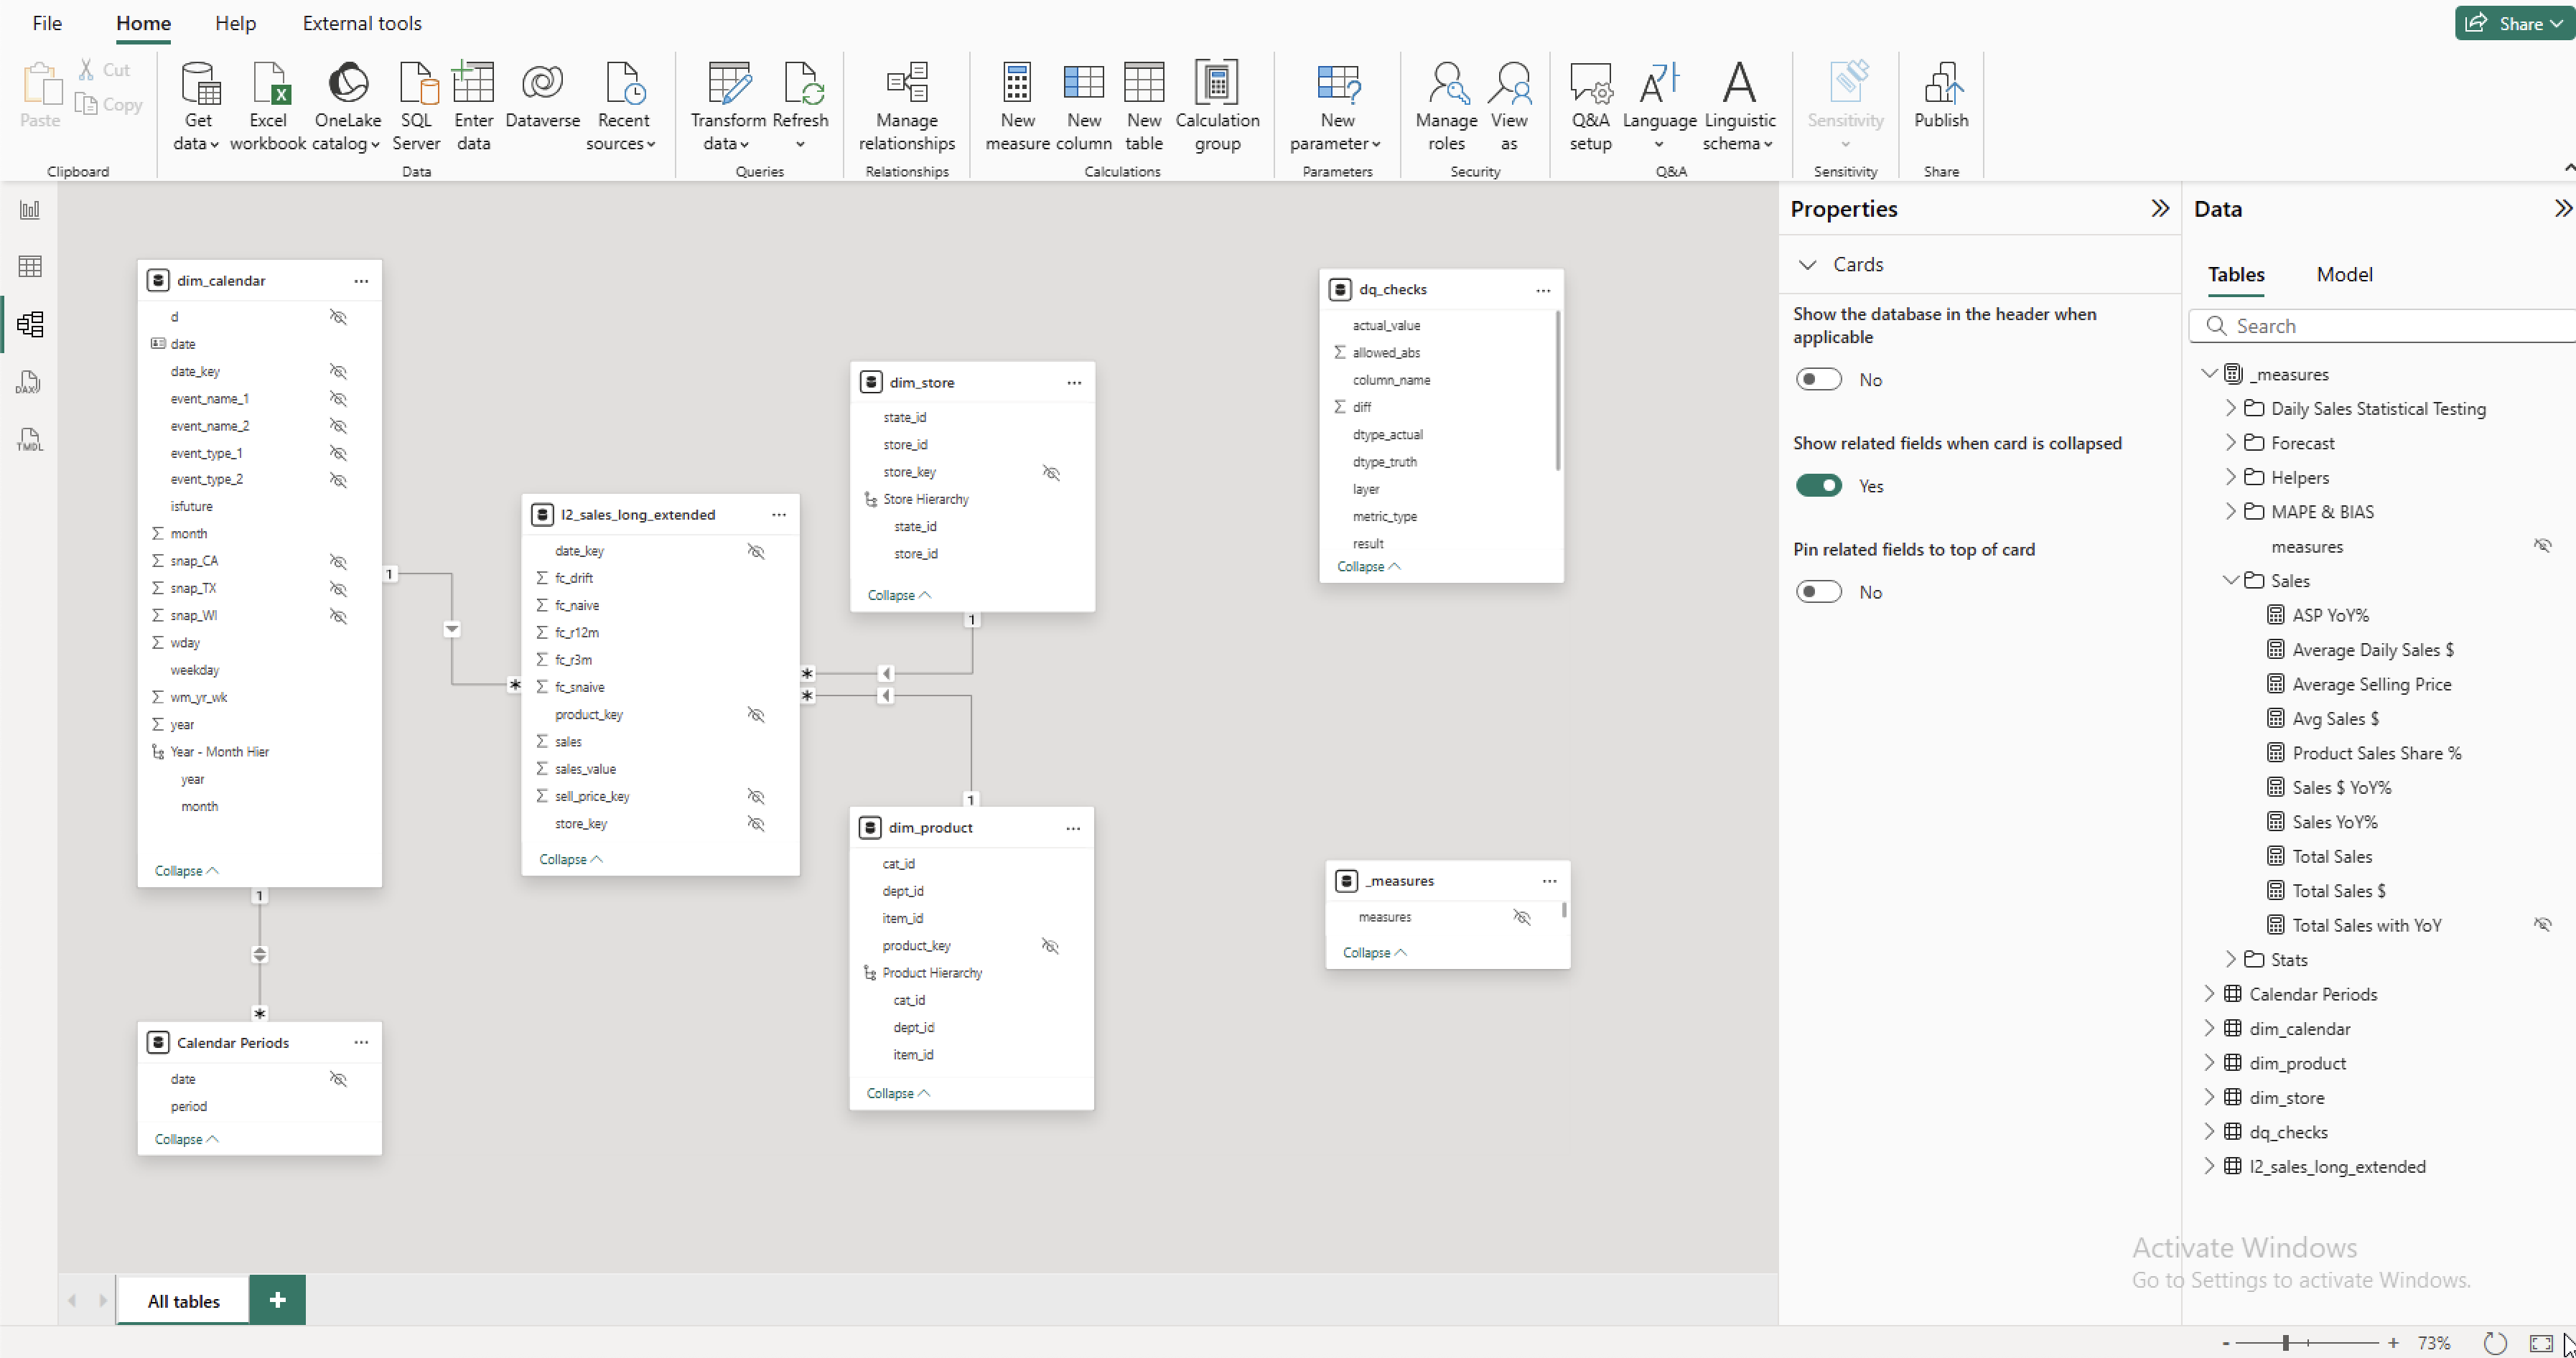
The data model follows a star schema structure — using keys and one-to-many
relationships
between
the fact and dimension tables. Additionally, the l2_sales_long_extended can aggregate
correctly against multiple periods without needing data duplication, due to the addition of the Calendar Periods table.
A dedicated _measures table groups all calculated measures into clear folders for easier
navigation.
Key columns are hidden, and while additional columns could be removed for optimization, they remain in
the
model
to support ongoing development and testing.
DAX
There are also best practices to follow when creating DAX measures. UsingASP YoY% as an
example:
VARimproves readability and avoids recalculating the same expression multiple times.DATEADDleverages time-intelligence functions for easy period comparisons.DIVIDEsafely handles division by zero, unlike the standard/operator.
ASP YoY% =
VAR PrevYear =
    CALCULATE([Average Selling Price], DATEADD('dim_calendar'[Date], -1, YEAR))
RETURN
    DIVIDE([Average Selling Price] - PrevYear, PrevYear)